Shear Force in a Beam Lab Report


Aim
Aim of this experiment is to study the effect of force magnitude on shear forces in a beam

Bending Moment in a Beam Lab Report

Aim of Bending Moment in a Beam

Aim of this experiment is to study effect of force magnitude on bending moment of beam


Theory Bending Moment in a Beam

Beams

A structural element which is designed and used to bear high load of structure and other external load is called beam. There are many different types of beam like cantilever beam, simple supported beam and overhanging beam. 

Bending of Beam

When an external load or the structural load applied in beam is large enough to displace the beam from its present place, then that deflection of beam from its resent axis is called bending of beam. 

Bending Moment

In simple words bending moment is the product of force applied on beam with the distance between the point of application of force and fixed end of the beam

Introduction to Experiment of Bending Moment in a Beam

This experiment is about studying the effect of force magnitude on bending of beam and for that structure hardware called ‘STR2 bending moment in a beam is used. 

According to the figure of STR2 bending moment in beam structure, beam is supported at two points using pivots. 

A mechanism is provided which can apply and calculate the force throughout the beam. Free body diagram of the apparatus is shown below.

Figure 1 bending moment apparatus


Figure 2 free body diagram

In this experiment load of different magnitude will applied on beam at the same place and bending moment will be calculated using the following formula.

Bending moment = Wa ((l-a))/l

Here
W is a the applied load on beam
a is the distance between the pivot point and point of force application.
l is the total length of the beam

Procedure
The apparatus involve in this experiment use an electronic system intrigued with software to apply load and calculate the bending moment. 

Due to which it is very important to follow the steps involve in this experiment in following presented order

Set up the computer software using the guide provided with the apparatus and set it to virtual experiment mode
In property section box, select the option of variable hanger load

From the tool box area take a load of 100 g and replace it with 0 gram at the cut section

Diagram of the force applied and the graph of the resultant force will appear of screen which conform the load replacement.

Software will automatically gather all the data of experiment and save it in memory. 

Repeat the third step with 200, 300, 400 and 500 grams and collect the data related to each experiment

Final result provided by software and manually calculation made were compared using graphs

Results

Table 1 bending moment Results

Calculations

Following is the equation which can be used for the bending moment calculation

Bending Moment = W* a*(l-a)/l

Here

W is a the applied load on beam
a is the distance between the pivot point and point of force application.
l is the total length of the beam

For W = 0
Bending Moment = W* a*(l-a)/l=0*400*(580-400)/580=0 N
For W = 0.98 
Bending Moment = W* a*(l-a)/l=0.98*400*(580-400)/580=0 N
For W = 1.96
Bending Moment = W* a*(l-a)/l=1.96*400*(580-400)/580=0 N
For W = 2.94
Bending Moment = W* a*(l-a)/l=2.94*400*(580-400)/580=0 N
For W = 3.92 
Bending Moment = W* a*(l-a)/l=3.92*400*(580-400)/580=0 N
For W = 4.90
Bending Moment = W* a*(l-a)/l=4.90*400*(580-400)/580=0 N

Percentage error

Percentage Error= PE = (Experimental shear force-Theoretical shear force)/(Theoretical shear force) 
× 100%

PE =  (0.5-0.486)/0.486  × 100%

PE =2.88 %

Table 2 bending moment calculation


Figure 3 bending moment graphs


Figure 4 bending moment comparison

Discussion on Bending Moment in a Beam

Values of the bending stresses obtain from the experiment are presented in the table above and they are arranged in the respective cell according to the load that produce that bending moment. 

All the data is presented in the graphs and according to that graph the theoretical bending moment is showing linear relation with the load means the value of the theoretical bending moment increase with the increase in the value of applied load and decrease with the decrease in the value of applied load. 

The ratio with which there is an increase and decrease in the value of theoretical bending moment is equal to the ratio with which there is an increase and decrease in the value of applied load.

Second graph is between bending stresses and the load but the main purpose of this graph is to compare the theoretical and experimental bending moment. 

According there is very little different between both value which show the correctness of apparatus and skills of the worker. Little different between the values is due to human error which cannot be minimize due to the human capabilities limitation. 

Conclusion on Bending Moment in a Beam
Aim of this task was to study the effect of different forces on the bending moment in the beam and the result show that there is a linear relationship between bending moment and applied load. 

Experimental and theoretical bending moment shows perfect linear relationship with applied load with very little difference in the values of bending moment.

Three Modes of Heat Transfer; Conduction, Convection and Radiation


Following are three methods of heat transfer
  • Conduction
  • Convection
  • Radiation

Different Types of Fluid Flow Measurement Devices

Following are the different types of fluid flow measurement devices which are available for the flow rate measurement. 
  • Orifice Plate
  • Venture Tube
  • Flow Nozzles
  • Variable Area

Orifice Plate
Advantages of Orifice Plate
•Orifice plate is very simplest instrument available which is also very easy to install and remove
•Have high pressure recover efficiency of 65 percent
•Have the ability of measure flow rate over a wide rage
•Cost effective

Disadvantages of  Orifice Plate
•It only support those fluid that are homogeneous is nature
•It work under a limited viscosity of fluid
•Accuracy of orifice plate depends on fluid density, viscosity and pressure
•Working limited to horizontal applications


Venture meter 
Advantages of Venture meter
Offer horizontal, vertical and inclined flow measurement
Perfect working behavior prediction
Very high pressure recovery efficiency of 90 %
Highly accurate for a wide range of flow rates

Disadvantages of Venture meter
•Required more space for installation as they have large is size due to their working method
•Have high initial cost 
•Difficult to install and remove
•Have limitation of minimum pipe diameter of 7.5 cm

Flow Nozzle

Advantages of Flow Nozzle
•Small in size as compared to venture meter
•Easy to install and remove
•Cost effective
•Discharge coefficient of flow nozzle is high

Disadvantages of Flow Nozzle
•Pressure recovery efficiency is low
•High maintenance cost
•Required more area as compared to orifice plate


Variable area

Advantages of Variable area
•Offers constant drop in pressure over the length of tube
•Simple construction
•Easy to install and maintain
•Work perfectly for liquid and gas

Disadvantage of Variable area
•Work only in vertical direction
•Transparent material is required for construction
•High pressure loss
•Limited rage for fluid viscosity

Four different types of flow measurement devices has been present above with their advantages and disadvantages and according to those venture meter is the best choice for the flow measurement devices, as it has highest value of pressure recovery efficiency, offer flow rate measurement in any direction and can work in wide range of flow rate. It has high cost and difficulty in installation but that’s one time cost for a flow measurement devices

Brinell Hardness Test

Hardness is one of the material properties that allows the material to resist plastic deformation. The plastic deformation may be because of penetration or in some other way. The resistance can also be from bending, scratching, abrasion or cutting etc.

Brinell Hardness Test Lab Report

Hardness is the mechanical property of the material which helps him in resisting the plastic deformation of the material. 

Plastics deformation can be form the starching, compression or due to indentation of any object in the work piece. 

Brinell hardness test is performed to find the hardness typically called the Brinell hardness. 

Procedure

  • Brinell hardness test in perform in such a way that first of all a work piece made of desire material is obtain and is fixed on the plate form of the brinell hardness testing machine. 
  • Then a small ball usually of 10 mm diameter, made of tungsten carbide is used to apply the load of about 3000 kg on the work piece. Load is applied for certain duration and then removed. 
  • Due to such high load the ball penetrate into the outer surface of the work piece and upon removal make cavity at that position. 
  • Diameter of the cavity is measured from at least two positions and these positions should be at right angle of each other. 
  • The diameter measured is then compared with the standard table provided with Brinell hardness machine form where the diameter reading is converted into the Brinell hardness number of the material.
  • Cavity diameter measured from the Brinell hardness machine is converted into the Brinell hardness number by the help of following formula


HB=  2F/(π×D×(D-√(D-d) ) )

Here 
F is the load applied
D is diameter of the ball used for indentation
d is the diameter of the impression produce by the ball on the work piece
HB is the Brinell hardness number of the material

Indentation measurement is the biggest error source in the Brinell hardness test because the measuring method is manual due to which the human error can cause problem. 

Due to the inexperience operator taking the reading the results of the experiment will different under the perfect condition but the non-perfect condition will bring more changes in the result. 

Over the years there two technologies developed to overcome the errors of the Brinell hardness test one is the automatic optimal Brinell scope and other is the Brinell units. 

First one make use of computer and images analysis to measure the Brinell hardness and second one make use of the ASTM E103 standard units to measure the Brinell hardness. 

The surface condition of the work piece can really affect the result of the experiment so that’s why the surface of the work piece is prepared by grinding. 

Brinell hardness number which is obtain from the Brinell hardness test is used to determine the hardness of any material or in other works the ability of the material to stop any object from penetrating into it. 

It can be said in the other words like that, Brinell hardness number of any material show its ability to maintain its shape or the ability of the material to resist the change in its shape. 

Brinell hardness number is used to select the material for the application where the outer shape of the object or product is very important like in aerospace application. 

Brinell hardness number can also be used for the selection of the material for the application where the object need to be hard enough to resist the penetration of any object in it like military tanks and built proof vehicles. 

Axial & Centrifugal Compressors Combustion Chamber, Turbine Blades and Exhaust System


Question 1 Axial and centrifugal compressors
a. What are the main parts of a centrifugal compressor and describe the function of each.

b. What are the main parts of an axial flow compressor

c. Describe the air flow through a centrifugal compressor

d. Describe the air flow through an axial flow compressor

e. What is a stage in an axial flow compressor and describe the air flow through a stage

f. Given an explanation as to why axial flow compressor rotor blades are twisted

g. List two methods of attaching rotor blades to a compressor drum

h. State the advantages and disadvantages of 1. Centrifugal compressor 2. Axial flow compressor

i. What are the main advantages of  twin spool compressor

j. Given an explanation of the term compressor stall

k. Given the explanation of the term compressor surge

l. List three situation that can cause a compressor to stall

m. Given an explanation as how variables inlet guide vanes can reduce or stop a compressor from stalling.

Gas turbine working with intake, compressor, combustur & Gears


Introduction:
In order to understand the purpose of compressor, intake and combustur there is need to understand the working of turbine in simple words. The air or gas comes from intake and compressed with the help of compressor through adiabatic process as no heat enter or leave the system and then it enters in combustion chamber where it get mixed with fuel and burn with constant pressure after that it is expand to drive the shaft. These mechanism can be divided into four stages 

Designing of belts, Clutch and Gear Assignment


Question No 1
A pulley system uses a flat belt of cross section area 1000 mm square and density 1150 kg/m^3.  The angle of the lap on the smaller wheel is 130, the coefficient of friction is 0.32 and the maximum force allowed in the belt is 550N and velocity is 9 m/sec. Calculate 

  • The maximum power when centrifugal force is not included
  • The maximum power when centrifugal force is included 
  • The initial belt tensions 

Construction Material for Bushfire Prone Areas


According to Wastiels, L. (2009) building structural design and building material are the two most important factors those need to be considered during the designing phase of the building.  Out of these two factors, building material will be discussed in this report. Selecting a building material is one of the most difficult tasks now a day because now it is not just selecting a strongest material for any building, now it is about fulfilling a certain criteria. 

Self-Healing Concrete


According to the Povindar K (1993) concrete is one of the best construction materials available now due to it’s to take large compressive loads. In the case when the applied load is more than the compressive strength of the concrete, load applied can produce cracks in the concrete column of in any other structure. Due to this crack the other properties of the concrete structure like permeability, durability and strength also start to decrease. To stop this decrease in properties the crack present in the concrete structure has to fix which cost a lot. According to the Kim Van Tittelboom (2008) crack in the concrete structure can be dangerous for the steel placed inside it for the higher strength. Moisture through the crack will enter the concrete structure due to which the steel start to rust, this further decrease the strength of the structure. 

Deflection of Beam Lab Report

1.0 Aim Deflection of Beam Lab Report

Aim of this lab work is to study and understand the deflection of beam made of different materials

2.0 Objective Deflection of Beam Lab Report

Study and understand different types of beams
Study and understand the permissible load of different beams
Study and understand the effect of beam material on deflection of beam
Study and understand the effect of beam geometry of beam bending

3.0 Introduction to Deflection of Beam Lab Report

3.1 Beams

According to Dr. R. K. Bansal (n.d) a structural element which is used to support heavy loads in different structures is called beam. 

Beam in any structure bears huge load which tries to bend the beam and beam support the structure by resisting the bending produce by the load. 

Ability of the beam to resist the load depends on the type of beam, material of beam and shape of beam, S Timoshenko (1940). 

According to  there are many different type of beam and each one of these beams can be of any material and can of many different shapes.

Some different types of beam are describe below

Simple supported beam

Simple supported beam is one which has support at its both ends but does not face any moving resistance

Fixed beam

Like simple supported beam fixed also has support at its both ends but fixed beam has moving resistance 

Over hanging beam

Over hanging beam also have support at both of its ends like simple supported beam but one of its ends is free and extended further from the end support

Double over hanging beam

Double over hanging beam is just like over hanging beam, the only difference is that its both ends are extended beyond the end support

Continuous beam

Continuous beam is one which has large length and it is supported by more than two supports

Cantilever beam

Cantilever beam is one which has its one end fixed and other end is free to vibrate

Trussed beam

Trussed beam is a special type of beam which has increased strength due to additional rods and cables in beam

In this experiment only two types of beam will be discussed one is simple supported beam and other is cantilever beam. 

Talking about the material of the beam, in this lab experiment three materials brass, aluminum and steel will be discussed.

3.2 Elastic Modulus 

Elastic modulus is the mechanical property of material which is the ratio of tensile stress and strain. 

Greater the value of the elastic modulus stiffer the material is and lower value of elastic modulus means the material deflect a lot at small stresses, M. F. Ashby (2010).

E=σ/ε
Where 
E is the Elastic modulus
σ = stress
ε = strain

3.3 Deflection

According to John Case (1999) when a body is under stress, then that stress tries to change its shape and dimensions. 

Change is shape of the body is called deflection and change in the dimensions is called strain. 

Following is the equation which can be used for calculating deflection in beams

δ=(FL^3)/KEI
Where
F is the force
L is length of beam
K is constant based on the position
E is elastic modulus
I is second moment of area

3.4 Permissible Load

Permissible load is the maximum amount of load which can be applied in the on to the beam it is also called the allowable load, Ferdinand P. Beer (n.d). 

This load shows the strength of any beam with respect of the load applied on it. It is very important to calculate the permissible load of all the beams in order to get a safe structure. 

According to P. Beer (2012) permissible load can be calculated with the help of Flexure formula whose equation is as follow


σ=My/I
σ=(F*x*y)/I

Where
F is the permissible load 
σ is the maximum value of stresses for material yield strength
x is the distance from the fixed point of beam to point of application of load
y is the Distance from the neutral axis to the point of interest
I is second moment of inertia or area

4.0 Procedure
Following is the procedure which was adopted to perform this experiment

  • First of all the apparatus was setup and beam was placed on it
  • Second the dial gauge was placed on its placed
  • Third weight pan was placed and weight was placed on it
  • Reading was taken for each and every increment of weight
  • Value was properly arranged in the tables
  • Procedure was repeated for different beams and different spans 


5.0 Dimensions of beams


5.1 Brass
Length of beam = 30 cm = 0.3 m
Cross section height = 0.31 cm = 0.0031m
Cross section width = 0.95 cm = 0.0095mm 

5.2 Aluminum
Length of beam = 30 cm = 0.3 m
Cross section height = 0.31 cm = 0.0031m
Cross section width = 0.95 cm = 0.0095mm

5.3 Steel
Length of beam = 30 cm = 0.3 m
Cross section height = 0.31 cm = 0.0031m
Cross section width = 0.95 cm = 0.0095mm

6.0 Simple supported beam calculations
6.1 Calculations for permissible load at 1/2 span


Flexure Formula
σ=My/I
σ=(F*x*y)/I
σ=11 MPa

Distance from the fixed point to application of force= x=0.15 m

Distance from the neutral axis to the point of interest y=0.00155

Second moment of inertia = I=1/12 bh^3=(0.0098*〖0.0031〗^3)/12=2.358*〖10〗^(-11) m^2

F=(11*2.358*〖10〗^(-11))/(0.15*0.00155)=(2.585*〖10〗^(-10))/(2.325*〖10〗^(-4) )=1.11 N

6.2 Calculations for permissible load at 1/4 span

Flexure Formula
σ=My/I
σ=(F*x*y)/I
σ=11 MPa

Distance from the fixed point to application of force= x=0.0075 m

Distance from the neutral axis to the point of interest y=0.00155

Second moment of inertia = I=1/12 bh^3=(0.0098*〖0.0031〗^3)/12=2.358*〖10〗^(-11) m^2

F=(11*2.358*〖10〗^(-11))/(0.075*0.00155)=(2.585*〖10〗^(-10))/(1.1625*〖10〗^(-4) )=2.2262 N

6.3 Calculation for Elastic Modulus at ½ spans

δ=(FL^3)/48EI
E=(FL^3)/48δI

Force = F = 1.96 N 

Length = L = 0.3 m

Deflection = δ = 2.21 mm = 0.00221 m

E=(1.96*〖0.3〗^3)/(48*0.00221*2.358*〖10〗^(-11) )=( 0.05292)/(2.5*〖10〗^(-12) )  

E= 2.1168*〖10〗^10 Pa

6.4 Calculation for Elastic Modulus at 1/4 spans

δ=Fa/48EI(3a^2-4l^2)
E=Fa/48δI(3a^2-4l^2)
Force = F = 1.96 N

Length = L = 0.3 m

Deflection = δ = 2.21 mm = 0.00045 m

E=(1.96*0.00075)/(48*0.00045*2.358*〖10〗^(-11) )(3*〖0.3〗^2-4*〖0.00075〗^2) 

E= 14327462781 Pa

7.0 Results of Deflection of Beam Lab Report

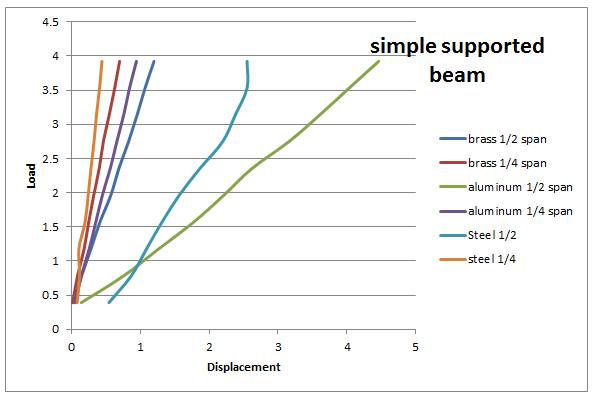
Experiments were performed on simple supported beam and cantilever beam made of three different material brass, aluminum and steel. Data of experiments was written in their respective tables. With the help of the data collected from the experiment graphs were prepared for each and every case and all those graphs are mention below.

7.1 Elastic Modulus of Different Material


8.0 Discussion on Deflection of Beam Lab Report

Six different experiments were performed to study and understand the deflection of simple supported beam and cantilever beam and results are been shown in two tables and six graphs in result section. Now each graph will be discussed here.
  • First graphs for simple supported beam made of brass and the values show a liner relation between load and displacement in ½ spans and ¼ spans. 
  • Values of the displacement of bam for brass is greater than steel because according To Kenneth G. (2010)  brass is more ductile than steel have lower value of elastic modulus
  • Second graph of aluminum shown the similar trends like the brass graphs. 
  • It also has liner response between load and displacement but its value of displacement for the given load is more than that of the brass which shows that aluminum is more ductile than that of brass as explained by B. K. Agrawal (2007). 
  • The third graph of steel has very graph of brass and steel and has linear response for both spans but its values of displacement at the given load is smallest from other two which show that steel is less ductile than other two and has highest value of elastic modulus and this property is being proved by George Murray (n.d).
  • Brass graph for cantilever show similar trends of first graph but in this graph value of displacement for both spans are very different. ¼ span show very little displacement with respect to the ½ span under the same load 10 as explained by Daniel D.
  • Pollock (n.d). Aluminum graphs for cantilever has the trend as of brass graph but the values are very different. 
  • Like brass graph ¼ span show very little deflection where ½ span show large deflection under the same load, Charles Gilmore (n.d). 
  • Steel graph for cantilever show very abnormal values of displacement. ¼ span of steel shows only 0.4 mm deflection at the highest load and ½ spans shows 2.5 mm deflection at highest load

According James M. Gere (n.d) to the equation of deflection, second moment of inertia of the beam which is the property of the beam related to its shape and dimension has very important role in deflection of beam. 

Beam with high value of second moment of inertia or second moment of area will show less deflection and beam with low value of second moment of inertia will show larger deflection. 

From this it can be concluded that the second moment of inertia is property of beam which resist the bending or deflection of beam. 

According to the table the value of elastic modulus for brass is about 37.5 GPa whereas the value of elastic modulus in books is 105 GPa which is almost three time the value obtain from the graphs or experiments. 

Like that for aluminum the value of elastic modulus is almost 26 GPa which is almost 2.5 times less than the book value of 69 GPa. For steel the elastic modulus value is about 29 GPa which more than six time less than the book value of 200 GPa. 

According to Raymond Aurelius Higgins (1994) there is a great different in values of elastic modulus, which shows that there are some errors in the experiment and those errors needed to discussed in order to get accurate values for elastic modulus.

Error in the beam experiments could be form two sources one in apparatus error and second is human error. Instrument error includes inaccurate dial gauge, apparatus not balance on horizontal surface or beam is already deformed. 

A personal error includes observation and calculation with wrong method or lack of experience in experimentation. 

Error in apparatus which is also known as instrument error can easily be find out by repeating a certain experiment over and over again if all experiment show inaccurate value means apparatus has some errors. 

It can be removed by calibrating it with a good standard apparatus. Personal error can find out by repeating the experiment with some experience person and can be removed by practices.

9.0 Conclusion on Deflection of Beam Lab Report

Aim of studying and understanding the different types of beams and effect of different factors in deflection of beam has been completed successfully. 

Six experiments were performed on two different types of beam under tow different conditions and result where plotted on graphs and were discussed in details. 

From these experiments it can be concluded that the deflection in a beam under a constant force depends on its type, shape, material and point of application of force. 

It can also be concluded that the experimental elastic modulus of same material is different in every case and really depends on the beam type, shape and loading place.