Jul 24, 2017

Electric Resistance Strain Gauges: Working, Position and Location of Installation


Working
Electrical strain gauge is a device which produces an electric signal whenever there is a strain on the object to which they are attached. In strain gauges electrical signal is produce due to the change in the resistance of the strain gauge. Strain gauges consist of single electrical wire which passes through strain gauge body as shown below. When strain is produce in any body the length of this wire of strain gauge is changed and a result the electric resistance of the strain gauge changes. This change in electric resistance is first amplified and then calculated to find the amount of strain produce in the object.


Jul 4, 2017

What is Single Shaft Turbine and Double Shaft Turbine


Single Shaft Turbines

Single shaft turbines are those which have single shaft running through the whole turbine means through compressor, turbine and generator of gas turbine. The working of such a turbine starts with the introduction of air in compressor section of turbine which has blades to compress the air. That compressed air them moves to the combustion chamber of the turbine where it get mixed with the fuel and burn to produce high temperature and high pressure gasses. Those high pressure and high temperature gasses then moves to turbine/power generation section where power is extracted from the hot gasses by the blades of the turbine. Blades use the hot gasses power to rotate the shaft of the generator or pump to produce the mechanical or electrical power output. All these rotating components like compressor, turbine and generator are made on single shaft.


Double Shaft Turbine

These turbines have two shafts in their system where one shaft moves between compressor and compressor turbine and second shaft moves between power turbine and generator of gas turbine. Working procedure of these shafts is little different from single shaft turbines and its starts with the introduction of air in compressor section of turbine which has blades to compress the air. That compressed air them moves to the combustion chamber of the turbine where it get mixed with the fuel and burn to produce high temperature and high pressure gasses. Those high pressure and high temperature gasses then moves to compression turbine section and from there they move to the turbine/power generation section which absorbs power from gasses. Power is use to rotate the shaft of the power turbine and that shat is attached with the generator which produce electrical or mechanical power output.


What is function of Regeneration and Reheating in gas turbines


Reheating

Reheating in gas turbine is done in order to increase the efficiency of the turbine. For this gas turbine is divided into number of stages and they are classified as high pressure turbine and low pressure turbine. At each stage power is produce based on the temperature and pressure of the gas. Procedure starts with the introduction of gasses at high temperature and high pressure into the turbine section having number of blades. Blades absorb power form gasses and after that gasses are eliminated from that section of gas turbine. When that gas at low temperature and pressure is received from the high pressure stage then it is reheated before it enters the low pressure turbine section. Is reheating is necessary because gas after existing the high pressure stage will be at such a low pressure that it cannot be used in second stage of gas turbine.


Regeneration

According to the working of the gas turbine the gasses for combustion are first get compresses in compressor and they move forwards for combustion. Temperature of gasses when they leave the compressor is lesser then the temperature of the gasses leaving the turbine after combustion and power production. Introduction of gasses in combustion chamber at high temperature will increase the efficiency of the turbine. To increase the temperature of gasses before they enter the combustion chamber, the gasses which are coming out of compressor are heat with the help of gasses which are coming out of the turbine outlet. For this heating purpose heat exchanger is used where hot gasses coming out of turbine flow in tubes and gasses coming out of compressor flow in shell of heat exchanger. During their flow in shell, gasses going into the combustion chamber gain heat through conduction and convection. 


What are Condensing Turbines and Back Pressure Turbines


Condensing Turbine

Condensing turbine get their name from their ability condenses steam in one of their outlet. Condensing turbine has two outlets from which one is used to utilize the medium pressure steam for heating process and other outlet do condensation process by utilize the low pressure steam. At the outlet (where medium pressure steam is utilize to get heating) on control value is present which is used to control the flow of steam over that outlet. By controlling the steam flow over that outlet the production of condensation process can be increased or decreased. The second outlet moves the steam to the condensation chamber where water flow over this steam. When water flow over high temperature steam, it absorb heat from the steam and get condense and then that condense water is moved toward boiler of the condensing turbine. 

The condensing turbine process starts with the entry of the high pressure and high temperature steam into the turbine section where it is utilize by the blades of the turbine to produce power. After the production of power the portion of steam which have moderate pressure is move out through first outlet to be utilized for heating and the portion of the steam whose pressure is to low to be used for any type of power production is move out through second outlet towards the condenser. In condenser water remove heat from steam and condense water is again move towards the boiler of the turbine.


Back Pressure Turbine

The back pressure steam turbine is one in which steam at high pressure and high temperature enters the turbine and that steam is used to rotate the turbine blades for power production. Back pressure steam turbine is also called the condensing steam turbine and reason for that is this turbine does not have condenser at its outlet and it has only one outlet. 

Working of back pressure steam turbine start with the entry of the high pressure steam into turbine power generation section where blades are present. Blades absorb power from steam and use it to product rotation in shaft of turbine. After providing power for shaft rotation, steam at low pressure and temperature exit the turbine from the outlet into the atmosphere and this is also the main difference between condensing and back pressure turbines. In back pressure turbine the outlet pressure of steam is so low that it cannot be used for any work. This outlet pressure depends on the load on turbine. 


Jul 2, 2017

Function of Turbocharger and Intercooler in Internal Combustion Power unit Performance


Turbocharger

Turbocharger is a name given to the device which is similar in working and components to the air compressor and it is being used in internal combustion power units to increase the efficiency of the internal combustion power unit. Turbocharger consists of a compressor housing which hold the compressor wheel inside it, turbine housing which hold turbine wheel inside it and one shaft which have both compressor wheel and turbine wheel mounted on it.


Working of turbocharger starts from the rotation of turbine which takes power form the hot gasses flowing out of the engine. Turbine uses this power to rotate the compressor wheel of the turbocharger because both of the wheels are mounted in the same wheel. Compressor compresses the outside air and forces it into the intake of the compressor. This increase in the inflow of air into the engine combustion chamber will increase the efficiency of the engine because the air fuel mixture will have more oxygen in it than the normal operation. Extra oxygen means effective combustion of fuel and this means more power with the same amount of the fuel used.


Intercooler

Explanation of the turbocharger has been explained in the above section and its main function is to provide the engine with the some air at high pressure. According to the principles of the thermodynamics at constant volume if pressure of the air is increase then its temperature will also increase. This increase in temperature of the air will result in decrease of engine efficiency so the air must be cooled before it enters the engine. For this purpose intercooler is used which is just a simple heat exchanger whose main function is to decrease the temperature of the air passing through its tubes. For cooling purpose fluid main be present in the pipes of the intercooler or low temperature air may flow over the fins of the heat exchanger, it’s all depends on the types of the heat exchanger used for this work. 


Second Law of thermodynamics With Heat Engine Example


Clausius Statement of Second Law of thermodynamics


According to the second law of thermodynamics it is impossible to have a thermodynamics system in which only the transfer of heat energy from cooler to hotter body is done.

Kelvin Planck Statement of Second Law of thermodynamics

According to the second law of thermodynamics it is not possible for any machine which work in close thermodynamic cycle and convert the energy obtain from the single heat source and convert it into work done on to its surrounding. 

Heat Engine

Heat engine is an energy conversion device which is design to convert the heat energy into mechanical energy. Heat engine convert the heat energy into mechanical energy by bringing the heat energy from high potential reservoir to low energy reservoir. According to this statement of second law that heat cannot flow from colder region to hotter region with the aid to external work, helps to determine the direction of flow of energy in heat engine. According to the other statement of second law that there is no device which only convert heat into energy, helps to determine the efficiency of the heat engine. 


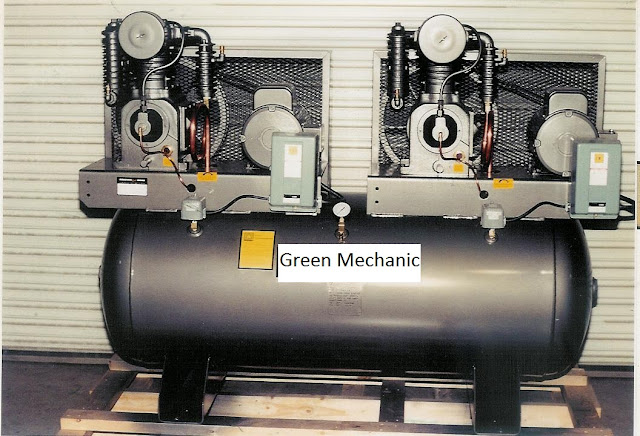
Five Dangers Associated With The Air Compressors


Following are the five dangers associated with the air compressors
  • Rupture
  • Oil Leaks
  • Foreign Particles
  • Overheating
  • Part failure

Rupture

One of the biggest dangers associated with the air compressors is the rupture of the air compressor under high pressure. Air compressors are made of heavy metals sheets and when air compressors will blast then it will break into small pieces of metal. Each one they will be able to kill any person which came under its range. 

Oil Leak

Lubrication is used to run the different parts of compressor smoothly but when proper care is not taken then this oil can leak into the compressor. If the compressor is being used in any workshop where fire or torch is being used then this oil leakage can very dangerous as it can cause explosion in the case both came in contact.

Foreign Particles

Any kind of unwanted particles which can go inside the compressor are very dangerous for the compressors and people working near the compressors. Foreign particles can cause explosion if they are flame able and came in contact with fire or they can block the outlet of compressor thus causing explosion due to high pressure.

Overheating

Filling the compressor with any gas under high pressure cause increase in temperature of the compressor and gas it is known that metal and gasses expand on heating. So of temperature of compressor increase more than it can handle the it can compressor failure which can cause fire at work place.

Part failure

In the case when proper maintenance is not done then ay part of the compressor can fail under ay condition. Part failure can be extremely dangerous for the worker working nearby because air in air compressor is at such a high pressure that its thin stream can create a hole in human body or can damage any sensitive part like eyes or ears

Jun 29, 2017

First Law of Thermodynamics with open and closed system Examples


First Law

Energy cannot be created nor destroyed in any isolated thermodynamics system but it can be changed from one form like heat into another form like work or internal energy or both. First law of thermodynamics follow the law of conservation of energy and it state that energy cannot be created nor be destroyed but it can be converted from one form to another form. From first law of thermodynamics it can be said that the internal energy of the system remains same and it is equal to the heat provided to the system minus the work done by the system.

Open System

Open system are those in which mass and heat can cross the boundaries of the system. Example of first law of thermodynamics for open system can be seen in pumps, turbines and heat exchanges where heat and mass cross the boundaries of the system. In such application the internal energy of the system is equal to the heat provided to the system minus the work by the system. In these system mass in slowing out of system boundaries which means a lot of energy or heat is getting wasted with mass but the system is in equilibrium as the required amount of heat is also being provided with inlet mass.

In the following example water is billing in a boiler with the top of the boiler wide open. Heat is providing to the system with the help of an external source (fire) and as a result of it internal energy of the water is increasing. With the increase in internal energy of water a lot of heat is wasted from the boilers walls and from the vapours going out of the boiler. This water boiling system is open system as heat and mass both are going out of the system


Closed System

Closed system is one in which mass of the system cannot leave the system boundaries but the heat can. First of thermodynamics has some example for closed system in which head enters and exist the system and system also give some work output but the system mass does not leave its boundaries one of this example is piston cylinder arrangement where heat provided is converted into motion of piston.

In the below example when boiler top is covered and steam is not allowed to leave the system the only heat can leave the system through the boundaries of system means from the walls of the boilers


Jun 28, 2017

How to Keep a Hundred Axle Modular Transporter’s Platform Horizontal


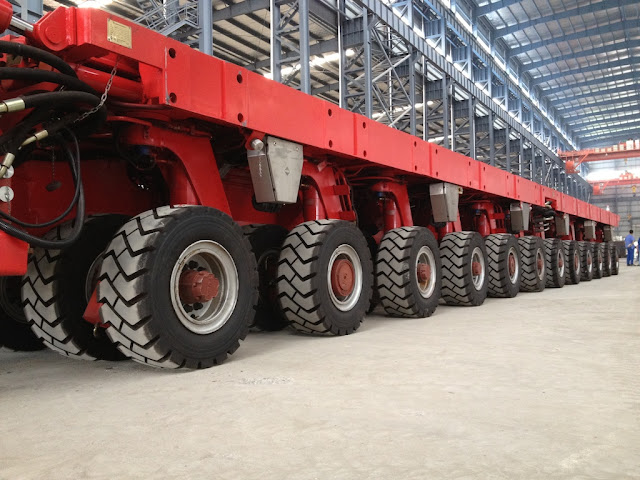
Have you ever seen a modular trailer with hundreds of axles? That is a perfect description of self-propelled modular trailers (SPMTs). The heavy haulers have the capacity to transport the heaviest loads from the land to offshore locations. So, how did the first self propelled modular transporter come about? Before the 1970s, engineers would fabricate pieces of large processing plants on site. This was possible because most of the projects were onshore. However, as engineer started working on offshore projects, heavy transport solutions were necessary. Engineers now fabricated large equipment on land. They then use modular transporters to move the equipment to the offshore destination. Read on and discover everything you need to know about heavy module transporters 

May 14, 2017

Laminar and Turbulent Pipe Flow Lab Report


Following are two objectives of this experiment

1.To compare the Reynolds Number and Darcy Friction coefficient

2.To compare the theoretical and experimental friction head losses in pipe flow

Apparatus for laminar flow and turbulent flow g

1.Smooth small diameter pipe

2.Water and mercury manometers

3.Flow rate measuring devices

4.Water

5.Thermometer

Procedure to check laminar flow and turbulent flow

1.First step is to setup the apparatus for experiment and check that weather the pipe is in perfect horizontal condition, check the flowrate it should be zero, check the difference in manometer readings it should be zero as well. 

2.Open the apparatus motor and adjust the flow rate of water. Note the volumetric flow rate of water using flow meter device

3.Note the reading of manometer and note the temperature of water

4.Calculate the Reynolds number and Darcy Friction Coefficient and compare the result

5.Note and Calculate the friction head losses and compare both results

 Study the flow of compressible fluids in a Pipe and Open Channel Flow

Calculations of laminar flow and turbulent flow


Friction head losses

h1-h2=h_f
h_f= 0.406-0.36=0.046 m

Flow rate in cubic meter per sec
Q=(V/t)/1000=0.006833/1000=0.000006833 m^3/sec  

Area
A=(πd^2)/4=3.14*〖0.003〗^2/4=0.000007065

Velocity 
V=Q/A
V=0.000006833/0.000007065=0.96 m/sec

Reynold Number
Re=ρvd/μ
Re=(1000*0.96*0.003)/0.0012=2418

𝞴exp
λ exp⁡〖= 〗  h_f/L*2gd/v^2 

λ exp⁡ =   0.046/0.524*(2*10*0.003)/〖0.96〗^2 =0.00563


laminar flow and turbulent flow graphs

Conclusion on Laminar and Turbulent flow

According of the line shown in the graph of friction losses and Reynold number, the friction losses increase with the increase in the Reynold number within the limit of the laminar flow means until the Reynold number is under 2000 range. 

After the Reynold number crosses the 2000 value means the laminar flow became the turbulent flow the friction losses decrease rapidly. 

This graphs show that there is a linear relation between the Reynold number and friction losses in every condition with difference in proportionality of the relation. 

In laminar low relation is directly proportional means with increase in Reynold number friction losses increase and with decrease in Reynold number friction losses decrease. 

In turbulent flow the relation is inversely proportional means with increase in Reynold number friction losses decrease and with decrease in Reynold number friction losses increase.

Value of λ has been calculated and shown in the table above and according to those readings λ increase with decrease in the value of the Reynold number and decrease with the increase in Reynold number. 

From this it can be said that the λ and Reynold number has inversely proportional relation. 

Friction losses during the flow of fluid in the pipe are due to the friction forces present between the fluid particles and between the pipe wall and fluid particles. 

This friction force uses some of the force present in the flowing fluid and due to this difference in the height of manometers (present on the same pipe at some distance) occurs. 

These losses are directly related to the Reynold number. According to the graph made between friction forces and Reynold number. 

In laminar low relation is directly proportional means with increase in Reynold number friction losses increase and with decrease in Reynold number friction losses decrease. 

In turbulent flow the relation is inversely proportional means with increase in Reynold number friction losses decrease and with decrease in Reynold number friction losses increase.

Experimental procedure has been shown above and in that procedure first step is to setup the apparatus for experiment. 

This step is the most important in procedure because if pipe is not fitted in perfect horizontal condition then some of fluid energy will be converted or obtained from potential energy of fluid because of difference in the heights of ends. 

If reading of the flowmeter or the manometer is not zero before the experiment starts then they will add or subtract some value from the original values of the experiment and that will make the complete experiment use less. 

During the experiment the process of taking the reading from the manometer and flow meter is very important. Reading shall be take accurately and noted on time to avoid any type of confusion and error in readings

Feb 12, 2017

Bending Stresses in Beam Lab Report


Aim
Aim of this experiment is to study the effect of force of different magnitude on the bending stresses in beam

Jan 29, 2017

Shear Force in a Beam Lab Report


Aim
Aim of this experiment is to study the effect of force magnitude on shear forces in a beam

Jan 28, 2017

Bending Moment in a Beam Lab Report

Aim of Bending Moment in a Beam

Aim of this experiment is to study effect of force magnitude on bending moment of beam


Theory Bending Moment in a Beam

Beams

A structural element which is designed and used to bear high load of structure and other external load is called beam. There are many different types of beam like cantilever beam, simple supported beam and overhanging beam. 

Bending of Beam

When an external load or the structural load applied in beam is large enough to displace the beam from its present place, then that deflection of beam from its resent axis is called bending of beam. 

Bending Moment

In simple words bending moment is the product of force applied on beam with the distance between the point of application of force and fixed end of the beam

Introduction to Experiment of Bending Moment in a Beam

This experiment is about studying the effect of force magnitude on bending of beam and for that structure hardware called ‘STR2 bending moment in a beam is used. 

According to the figure of STR2 bending moment in beam structure, beam is supported at two points using pivots. 

A mechanism is provided which can apply and calculate the force throughout the beam. Free body diagram of the apparatus is shown below.

Figure 1 bending moment apparatus


Figure 2 free body diagram

In this experiment load of different magnitude will applied on beam at the same place and bending moment will be calculated using the following formula.

Bending moment = Wa ((l-a))/l

Here
W is a the applied load on beam
a is the distance between the pivot point and point of force application.
l is the total length of the beam

Procedure
The apparatus involve in this experiment use an electronic system intrigued with software to apply load and calculate the bending moment. 

Due to which it is very important to follow the steps involve in this experiment in following presented order

Set up the computer software using the guide provided with the apparatus and set it to virtual experiment mode
In property section box, select the option of variable hanger load

From the tool box area take a load of 100 g and replace it with 0 gram at the cut section

Diagram of the force applied and the graph of the resultant force will appear of screen which conform the load replacement.

Software will automatically gather all the data of experiment and save it in memory. 

Repeat the third step with 200, 300, 400 and 500 grams and collect the data related to each experiment

Final result provided by software and manually calculation made were compared using graphs

Results

Table 1 bending moment Results

Calculations

Following is the equation which can be used for the bending moment calculation

Bending Moment = W* a*(l-a)/l

Here

W is a the applied load on beam
a is the distance between the pivot point and point of force application.
l is the total length of the beam

For W = 0
Bending Moment = W* a*(l-a)/l=0*400*(580-400)/580=0 N
For W = 0.98 
Bending Moment = W* a*(l-a)/l=0.98*400*(580-400)/580=0 N
For W = 1.96
Bending Moment = W* a*(l-a)/l=1.96*400*(580-400)/580=0 N
For W = 2.94
Bending Moment = W* a*(l-a)/l=2.94*400*(580-400)/580=0 N
For W = 3.92 
Bending Moment = W* a*(l-a)/l=3.92*400*(580-400)/580=0 N
For W = 4.90
Bending Moment = W* a*(l-a)/l=4.90*400*(580-400)/580=0 N

Percentage error

Percentage Error= PE = (Experimental shear force-Theoretical shear force)/(Theoretical shear force) 
× 100%

PE =  (0.5-0.486)/0.486  × 100%

PE =2.88 %

Table 2 bending moment calculation


Figure 3 bending moment graphs


Figure 4 bending moment comparison

Discussion on Bending Moment in a Beam

Values of the bending stresses obtain from the experiment are presented in the table above and they are arranged in the respective cell according to the load that produce that bending moment. 

All the data is presented in the graphs and according to that graph the theoretical bending moment is showing linear relation with the load means the value of the theoretical bending moment increase with the increase in the value of applied load and decrease with the decrease in the value of applied load. 

The ratio with which there is an increase and decrease in the value of theoretical bending moment is equal to the ratio with which there is an increase and decrease in the value of applied load.

Second graph is between bending stresses and the load but the main purpose of this graph is to compare the theoretical and experimental bending moment. 

According there is very little different between both value which show the correctness of apparatus and skills of the worker. Little different between the values is due to human error which cannot be minimize due to the human capabilities limitation. 

Conclusion on Bending Moment in a Beam
Aim of this task was to study the effect of different forces on the bending moment in the beam and the result show that there is a linear relationship between bending moment and applied load. 

Experimental and theoretical bending moment shows perfect linear relationship with applied load with very little difference in the values of bending moment.