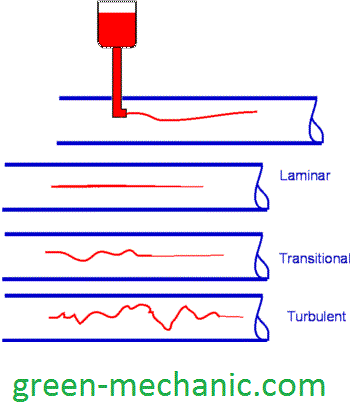
Laminar and Turbulent Pipe Flow Lab Report

Following are two objectives of this experiment
1.To compare the Reynolds Number and Darcy Friction coefficient
2.To compare the theoretical and experimental friction head losses in pipe flow
Apparatus for laminar flow and turbulent flow g
1.Smooth small diameter pipe
2.Water and mercury manometers
3.Flow rate measuring devices
4.Water
5.Thermometer
Procedure to check laminar flow and turbulent flow
1.First step is to setup the apparatus for experiment and check that weather the pipe is in perfect horizontal condition, check the flowrate it should be zero, check the difference in manometer readings it should be zero as well.
2.Open the apparatus motor and adjust the flow rate of water. Note the volumetric flow rate of water using flow meter device
3.Note the reading of manometer and note the temperature of water
4.Calculate the Reynolds number and Darcy Friction Coefficient and compare the result
5.Note and Calculate the friction head losses and compare both results
Study the flow of compressible fluids in a Pipe and Open Channel Flow
Calculations of laminar flow and turbulent flow

Conclusion on Laminar and Turbulent flow
According of the line shown in the graph of friction losses and Reynold number, the friction losses increase with the increase in the Reynold number within the limit of the laminar flow means until the Reynold number is under 2000 range. After the Reynold number crosses the 2000 value means the laminar flow became the turbulent flow the friction losses decrease rapidly.
This graphs show that there is a linear relation between the Reynold number and friction losses in every condition with difference in proportionality of the relation.
In laminar low relation is directly proportional means with increase in Reynold number friction losses increase and with decrease in Reynold number friction losses decrease.
In turbulent flow the relation is inversely proportional means with increase in Reynold number friction losses decrease and with decrease in Reynold number friction losses increase.
Value of λ has been calculated and shown in the table above and according to those readings λ increase with decrease in the value of the Reynold number and decrease with the increase in Reynold number.
From this it can be said that the λ and Reynold number has inversely proportional relation.
Friction losses during the flow of fluid in the pipe are due to the friction forces present between the fluid particles and between the pipe wall and fluid particles.
This friction force uses some of the force present in the flowing fluid and due to this difference in the height of manometers (present on the same pipe at some distance) occurs.
These losses are directly related to the Reynold number. According to the graph made between friction forces and Reynold number.
In laminar low relation is directly proportional means with increase in Reynold number friction losses increase and with decrease in Reynold number friction losses decrease.
In turbulent flow the relation is inversely proportional means with increase in Reynold number friction losses decrease and with decrease in Reynold number friction losses increase.
Experimental procedure has been shown above and in that procedure first step is to setup the apparatus for experiment.
This step is the most important in procedure because if pipe is not fitted in perfect horizontal condition then some of fluid energy will be converted or obtained from potential energy of fluid because of difference in the heights of ends.
If reading of the flowmeter or the manometer is not zero before the experiment starts then they will add or subtract some value from the original values of the experiment and that will make the complete experiment use less.
During the experiment the process of taking the reading from the manometer and flow meter is very important. Reading shall be take accurately and noted on time to avoid any type of confusion and error in readings


Comments
Post a Comment